8.5 Integration as the limit of a sum
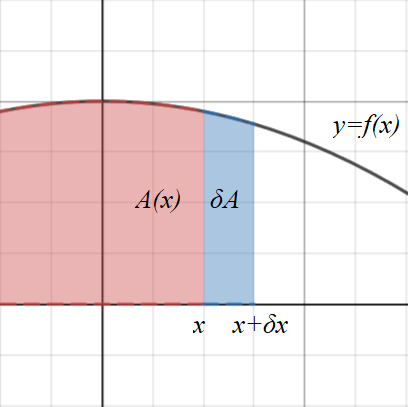
Consider a graph of \(y=f(x)\). The area under the curve to the left of \(x\) can be defined as a function of \(x\) called \(A(x)\).

If \(x\) increases by a small amount \(\delta x\), the area increases by an amount \(\delta A \).
This increase \(\delta A\) is approximately rectangular and is approximately \(y \delta x\).
\(\delta A\ ≈ y \delta x\ \implies \dfrac{\delta A}{\delta x} ≈ y \)
As \(\delta x→0\), any error between \(y \delta x\) and the actual area will be negligible.
\(\lim\limits_{\delta x→0} \dfrac{\delta A}{\delta x} = y \implies \dfrac{dA}{dx} = y \)
Integrating both sides with respect to \(x\) gives:
\(\displaystyle\int{\dfrac{dA}{dx}} dx = \displaystyle\int{y} dx \implies A = \displaystyle\int{y} dx\)
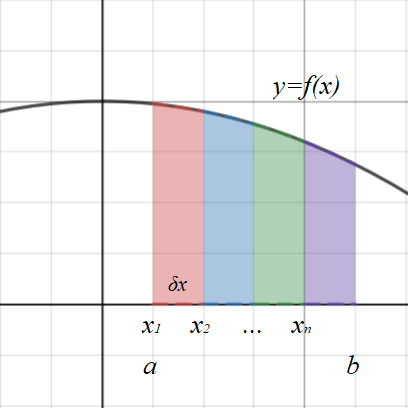
Consider the graph below. The area bounded by \(y=f(x)\), \(x=a\), \(x=b\) and the \(x\)-axis can be approximated by calculating the sum of many rectangles.

The sum of all \(n\) rectangles can be written as:
\(Area ≈ f(x_1)\delta x + f(x_2)\delta x + ... + f(x_n)\delta x \)
\(\implies Area ≈ \displaystyle\sum_{k=1}^n{f(x_k)\delta x} \)
This value can be made more accurate by using a large number of very thin rectangles. The exact area can be found when \(n→∞\) and \(\delta x → 0\).
\(Area = \lim\limits_{n→∞} \displaystyle\sum_{k=1}^n f(x_k) \delta x \)
The lower and upper limits on the sum correspond to the first and last rectangle where \(x=a\) and \(x=b\) respectively, so this could also be written as:
\(Area = \lim\limits_{\delta x→0} \displaystyle\sum_{x=a}^b f(x) \delta x \)
This is equivalent to notation for definite integration:
\(\boxed{\displaystyle\int_a^b{f(x)} dx = \lim\limits_{\delta x→0} \displaystyle\sum_{x=a}^b f(x) \delta x} \)

If \(x\) increases by a small amount \(\delta x\), the area increases by an amount \(\delta A \).
This increase \(\delta A\) is approximately rectangular and is approximately \(y \delta x\).
\(\delta A\ ≈ y \delta x\ \implies \dfrac{\delta A}{\delta x} ≈ y \)
As \(\delta x→0\), any error between \(y \delta x\) and the actual area will be negligible.
\(\lim\limits_{\delta x→0} \dfrac{\delta A}{\delta x} = y \implies \dfrac{dA}{dx} = y \)
Integrating both sides with respect to \(x\) gives:
\(\displaystyle\int{\dfrac{dA}{dx}} dx = \displaystyle\int{y} dx \implies A = \displaystyle\int{y} dx\)
Consider the graph below. The area bounded by \(y=f(x)\), \(x=a\), \(x=b\) and the \(x\)-axis can be approximated by calculating the sum of many rectangles.

The sum of all \(n\) rectangles can be written as:
\(Area ≈ f(x_1)\delta x + f(x_2)\delta x + ... + f(x_n)\delta x \)
\(\implies Area ≈ \displaystyle\sum_{k=1}^n{f(x_k)\delta x} \)
This value can be made more accurate by using a large number of very thin rectangles. The exact area can be found when \(n→∞\) and \(\delta x → 0\).
\(Area = \lim\limits_{n→∞} \displaystyle\sum_{k=1}^n f(x_k) \delta x \)
The lower and upper limits on the sum correspond to the first and last rectangle where \(x=a\) and \(x=b\) respectively, so this could also be written as:
\(Area = \lim\limits_{\delta x→0} \displaystyle\sum_{x=a}^b f(x) \delta x \)
This is equivalent to notation for definite integration:
\(\boxed{\displaystyle\int_a^b{f(x)} dx = \lim\limits_{\delta x→0} \displaystyle\sum_{x=a}^b f(x) \delta x} \)
Important
Integration as the limit of a sum
\(\displaystyle\int_a^b{f(x)} dx = \lim\limits_{\delta x→0} \displaystyle\sum_{x=a}^b f(x) \delta x \)
\(\displaystyle\int_a^b{f(x)} dx = \lim\limits_{\delta x→0} \displaystyle\sum_{x=a}^b f(x) \delta x \)
3