2.3 Quadratic functions and graphs
Quadratic functions look like this:\(f(x)=ax^2+bx+c\)
The shape of a quadratic graph \(y=f(x)\) is called a parabola.
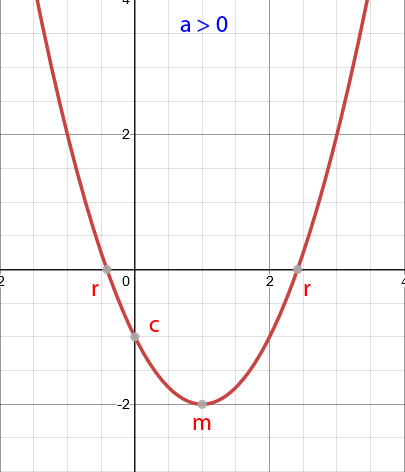
The value of \(a\) determines the shape of the parabola.
The graph crosses the x-axis (r) when \(y=0\). These are known as the x-intercepts, and can be calculated by finding the roots of the function \(f(x)\).
The graph crosses the y-axis (c) when \(x=0\). This is known as the y-intercept, and is equal to the value of \(c\).
The turning point (maximum or minimum) of the graph (m) is halfway between the two roots, because of the symmetry of the parabola. You can also find the turning point by completing the square.
If \(f(x)=a(x-p)^2+q\), the graph \(y=f(x)\) has a turning point at \((p,q)\).
The shape of a quadratic graph \(y=f(x)\) is called a parabola.
The value of \(a\) determines the shape of the parabola.
When \(a>0\), the parabola will have a "u" shape.
When \(a<0\), the parabola will have a "n" shape.
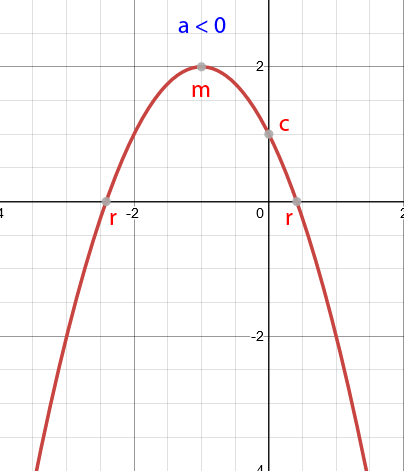
The graph crosses the x-axis (r) when \(y=0\). These are known as the x-intercepts, and can be calculated by finding the roots of the function \(f(x)\).
The graph crosses the y-axis (c) when \(x=0\). This is known as the y-intercept, and is equal to the value of \(c\).
The turning point (maximum or minimum) of the graph (m) is halfway between the two roots, because of the symmetry of the parabola. You can also find the turning point by completing the square.
If \(f(x)=a(x-p)^2+q\), the graph \(y=f(x)\) has a turning point at \((p,q)\).
Important
Quadratic functions have the form:
\(f(x)=ax^2+bx+c\)
\(f(x)=ax^2+bx+c\)
3