2.15 Graphs of functions
You need to understand, sketch and use graphs of the following functions:
Cubic functions
Cubic functions have the general form \(ax^3+bx^2+cx+d\), and ones which you have to sketch can usually be factorised into the form \((x+a)(x+b)(x+c)\). They can have up to three roots.
Tip: Try to use the factor theorem to find factors quickly.
Quartic functions
Quartic functions have the general form \(ax^4+bx^3+cx^2+dx+e\), and ones which you have to sketch can usually be factorised into the form \((x+a)(x+b)(x+c)(x+d)\). They can have up to four roots.
Tip: Try to use the factor theorem to find factors quickly.
Reciprocal functions
Reciprocal functions have the general form \(\dfrac{a}{x^n}\). The shape depends on whether \(n\) is odd or even, and whether \(a\) is positive or negative.
Asymptotes (lines which the graph approaches but never touches) are shown as red dashed lines.
Modulus of linear functions
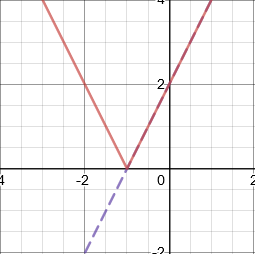
The modulus of a function means "turning any negative numbers into positive numbers" for that function. The modulus of a linear function is therefore V-shaped. The negative section of the linear function is reflected about the \(x\)-axis.
The linear function is represented by the purple dashed line, and its modulus is represented by the solid red line.
Intersections of graphs
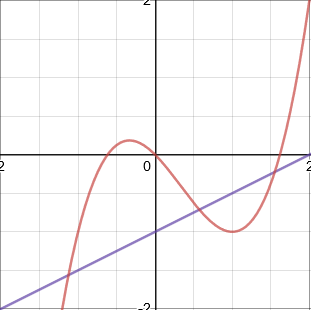
The \(x\)-coordinate(s) at the point(s) of intersection of the graphs \(y=f(x)\) and \(y=g(x)\) are the solution(s) of the equation \(f(x)=g(x)\).
For example, in the diagram below, there are three solutions to the equation \(f(x)=g(x)\), because there are three intersections.
- Cubic functions
- Quartic functions
- Reciprocal functions
- Modulus of linear functions
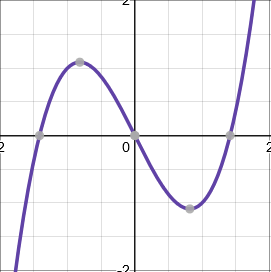
Cubic functions
Cubic functions have the general form \(ax^3+bx^2+cx+d\), and ones which you have to sketch can usually be factorised into the form \((x+a)(x+b)(x+c)\). They can have up to three roots.
Tip: Try to use the factor theorem to find factors quickly.
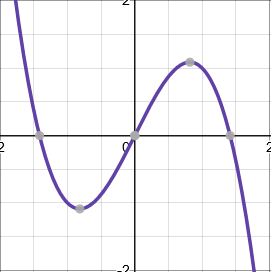
When \(a>0\), the graph starts at the bottom left, and finishes at the top right.
When \(a<0\), the graph starts at the top left, and finishes at the bottom right.
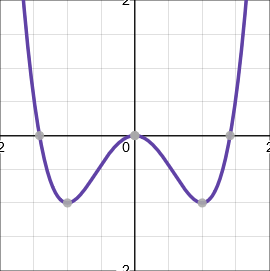
Quartic functions
Quartic functions have the general form \(ax^4+bx^3+cx^2+dx+e\), and ones which you have to sketch can usually be factorised into the form \((x+a)(x+b)(x+c)(x+d)\). They can have up to four roots.
Tip: Try to use the factor theorem to find factors quickly.
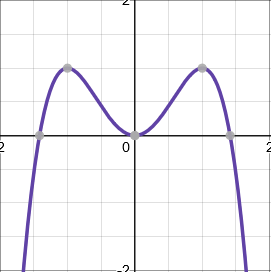
When \(a>0\), the graph starts at the top left, and finishes at the top right.
When \(a<0\), the graph starts at the bottom left, and finishes at the bottom right.
Reciprocal functions
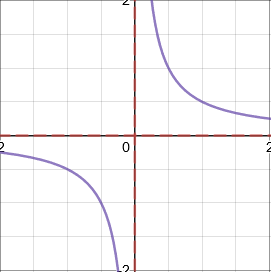
Reciprocal functions have the general form \(\dfrac{a}{x^n}\). The shape depends on whether \(n\) is odd or even, and whether \(a\) is positive or negative.
Asymptotes (lines which the graph approaches but never touches) are shown as red dashed lines.
- Horizontal asymptotes are calculated by considering what happens to the graph for very small and large values of \(x\).
- Vertical asymptotes are calculated by considering what happens to the graph for very small and large values of \(y\).
When \(a>0\) and \(n\) is odd, e.g. \(y=\dfrac{1}{x}\)
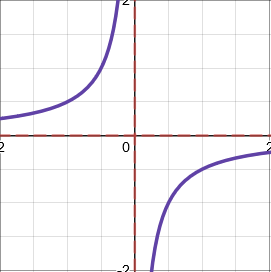
When \(a<0\) and \(n\) is odd, e.g. \(y=\dfrac{-1}{x}\)
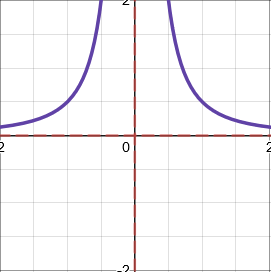
When \(a>0\) and \(n\) is even, e.g. \(y=\dfrac{1}{x^2}\)
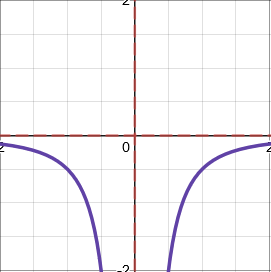
When \(a<0\) and \(n\) is even, e.g. \(y=\dfrac{-1}{x^2}\)
Modulus of linear functions
The modulus of a function means "turning any negative numbers into positive numbers" for that function. The modulus of a linear function is therefore V-shaped. The negative section of the linear function is reflected about the \(x\)-axis.
The linear function is represented by the purple dashed line, and its modulus is represented by the solid red line.
Intersections of graphs
The \(x\)-coordinate(s) at the point(s) of intersection of the graphs \(y=f(x)\) and \(y=g(x)\) are the solution(s) of the equation \(f(x)=g(x)\).
For example, in the diagram below, there are three solutions to the equation \(f(x)=g(x)\), because there are three intersections.
Important
Asymptotes are lines which the graph approaches but never touches.
3